
Lab instructions and notes on some of the advanced data topics in Power BI.
DirectQuery
Create a Composite PBI Report
- Data Source
- DirectQuery: FactInternetSales, FactResellerSales, FactSalesQuota
- Import: DimDate, DimProduct, DimProductCategory, DimProductSubcategory
- Data Transformation
- DimDate
- Remove all columns except DateKey, AlternateDateKey, DayOfWeek, DayNameofWeek, EnglishMonthName, MonthNumberOfYear, CalendarQuarter, CalendarYear, FiscalQuarter, FiscalYear
- Rename Columns AlternateDateKey to Date Value, DayOfWeek to Day Of Week, DayNameofWeek to Day Name, EnglishMonthName to Month Name
- Rename table to Date
- DimProduct
- Remove all columns except ProductKey, EnglishProductName, StandardCost, Color, ListPrice, Subcategorykey
- Merge with DimProductSubcategory to bring in ProductCategoryKey, EnglishProductSubcategoryName
- Merge with DimProductCategory to bring EnglishProductCategoryName
- Rename columns EnglishProductName to Product, EnglishProductSubcategoryName to Subcategory, EnglishProductCategoryName to Category
- Remove columns ProductCategoryKey, ProductSubCategoryKey
- Disable load for DimProductCategory and DimProductSubcategory
- Rename table to Product
- Change datatype to Date for any DateTime datatype columns in FactInternetSales, FactResellerSales, FactSalesQuota (to qualify that you can do some data transformations still in DirectQuery mode)
- DimDate
- Data Modelling
- Add hierarchy to Product as Products (Category - Subcategory - Product)
- Notice that relationships to Fact tables (direct-queried) are amiss! Have you tried auto-detect relationships? Go to Data tab (right above model tab), notice that data is not displayed for the three facts
- Manually establish relationships to three fact tables from
- Date (for any number of DateKey columns in facts)
- Product (ProductKey)
- Two Measures! (within FactInternetSales) - Profit = CALCULATE(SUM(FactInternetSales[SalesAmount]) - SUM(‘FactInternetSales’[TotalProductCost])) - Profit % = CALCULATE([Profit]/SUM(FactInternetSales[SalesAmount]))
- Report
- Add matrix with
- Rows: Products hierarchy
- Values: SalesAmount, Profit, Profit %
- Notice that Sensitivity button is disabled (yup, its pushed to source data instead of at PBI level now, because of…)
- Add matrix with
Performance Analyzer
- Start recording and Analyse the outcome from View -> Performance Analyzer for current report
- Start recording and Analyse the outcome from View -> Performance Analyzer for the report created yesterday, as well available here.
- Notice the impact on performance when you revisit the report tabs
User Aggregations
- Keeping the same report open, go to Transformation tab, and source DimPromotion using DirectQuery mode (you can use Recent Sources)
- Remove all columns except PromotionKey, EnglishPromotionName, EnglishDiscountPct, EnglishPromotionType, PromotionCategory, MinQty, MaxQty
- Within Query pane (left), right click -> New Query -> Blank
- In formula bar add = FactInternetSales and press enter (this will replicate FactInternetSales as a new table). Rename this query to FactInternetSalesQuery. Click on Close & Apply
- In Model view, ensure DimPromotion and FactInternetSalesQuery are connected via PromotionKey
- Within Fields pane (right), right click on FactInternetSalesQuery and select Manage Aggregations
- Scroll down to find PromotionKey (within Aggregation Column), and select following values for subsequent three dropdown and click ApplyAll after that:
- (Summarization) GroupBY
- (Detail Table) DimPromotion
- (Detail Column) PromotionKey
- Go to Report mode, add table visual and add PromotionKey, SalesAmount to visual
- Enable Performance Analyzer (under View tab), and refresh data
- Notice that DirectQuery counter is zero. Its because system is reporting from memory.
- Move to other report tab, refresh data again, and see the variation against DirectQuery in Performance Analyzer output. Its because now system is hitting the system.
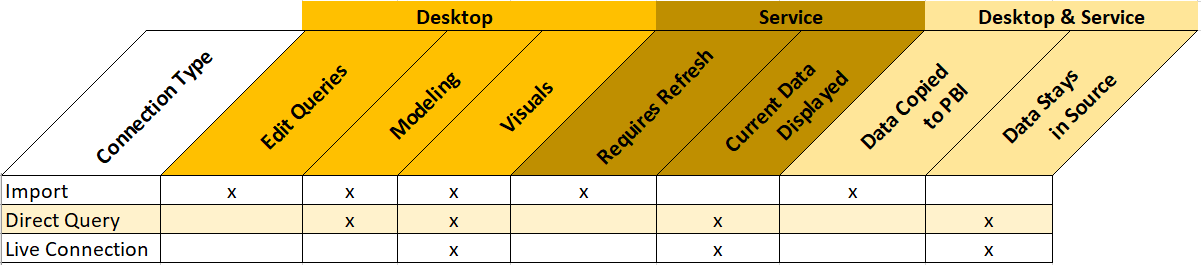
DirectQuery vs Import
- Pro
- Data refreshes
- Smaller file footprint
- Less storage
- Cons
- Sizing limits
- Less storage (no caching - meaning uncompressed data stored on PBIService directly)
- Limited transformations
- Slower performance (network bandwidth, vertipaq isnt involved!)
- Sources supported (or not) by DirectQuery (ref)
DirectQuery vs Live Connections
- Live: Analysis Service (user identity is passed to Analysis service)
When to use DirectQuery
- Frequent data change
- Near real time reporting needs (note that its still not live or real time!)
- Data is very large
- ODS has the security rules
- Data sovereignty
- OLAP data source (e.g. SAP HANA/BW)
What wont work? (vs Import)
- Reference
- Calculated tables and columns from a SSO source
- Auto Date/Time
- Sizing Limits (1mil rows, 125 cols, 4MB per row payload, 16MB datasize for visual)
- Sizing not applicable to aggregations or calculations
- Certain limits can be lifted with Premium
- Certain measures not applicable to row counts, e.g. MIN, MAX, LAST, FIRST
Resulted file from this lab is available here.