
Lab instructions on exploring and using additional / advanced PBI reporting capabilities.
Advanced Visualization Capabilities
- Explainable Analytics
- Forecasting
- Top Down Analysis
- Key Influencers
- Working with Themes
- Working with Accessibility
- Real time analytics
- Paginated Reports
- PBI Application Lifecycle and Deployment Strategy
Advanced Visualization Capabilities
Explainable Analytics (Smart Narrative)
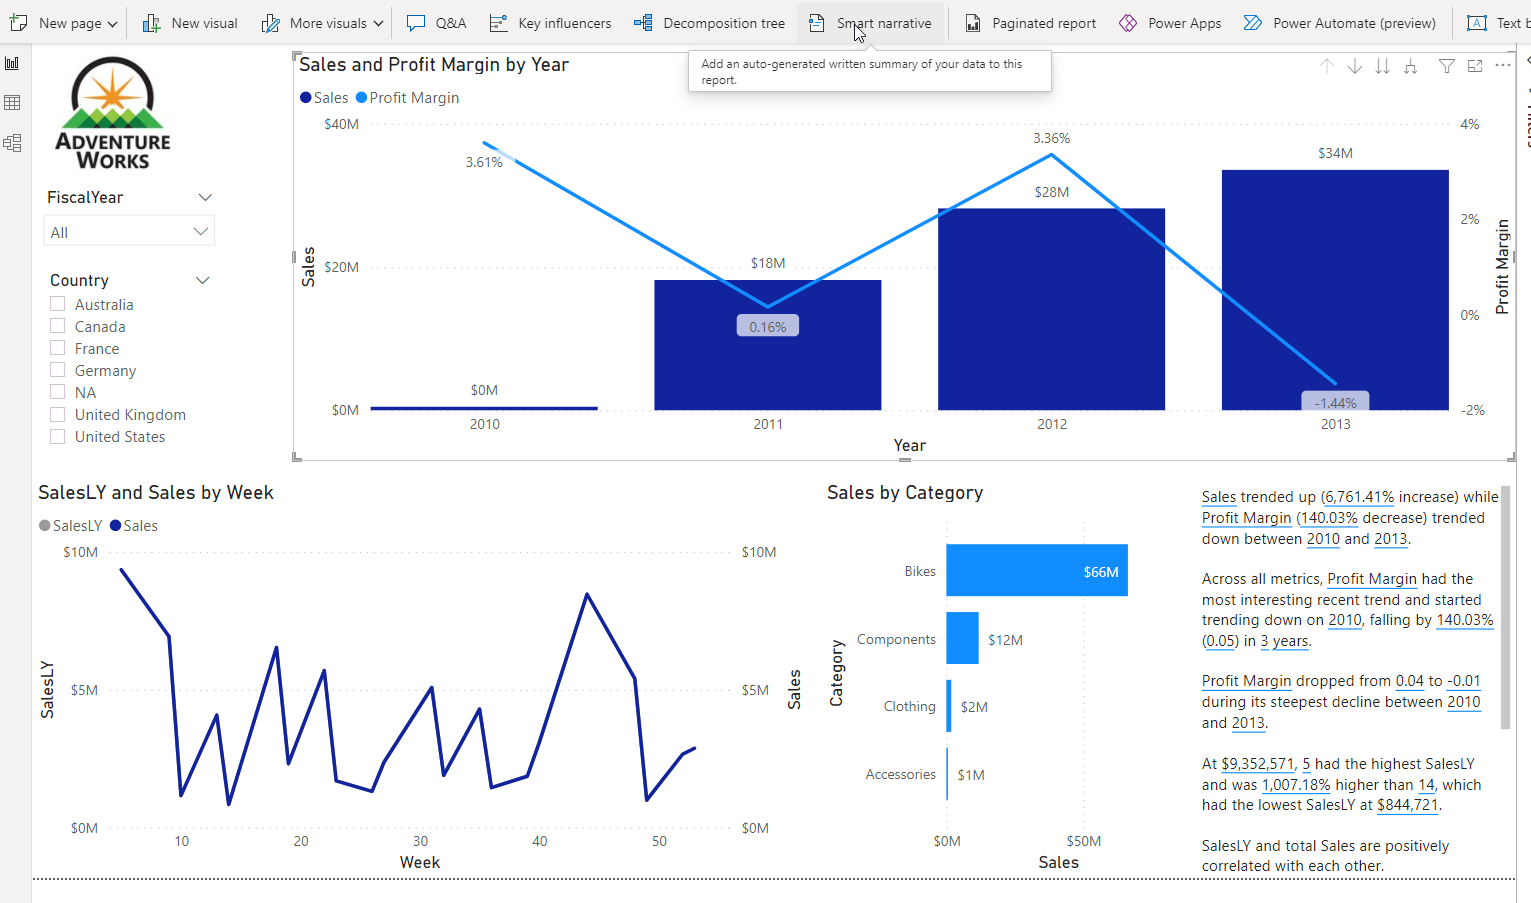
Open the PBI Desktop file for previously uploaded reports pack. On Overview tab, reduce the width of last two visuals to make some space on bottom left corner, and click on Smart Narrative button (under Insert menu). Explore the findings in narration box by filtering on other visuals and slicers. Here’s a sample screenshot.
Forecasting (Line Chart)
-
Add a new tab to the report and rename it to Forecast
-
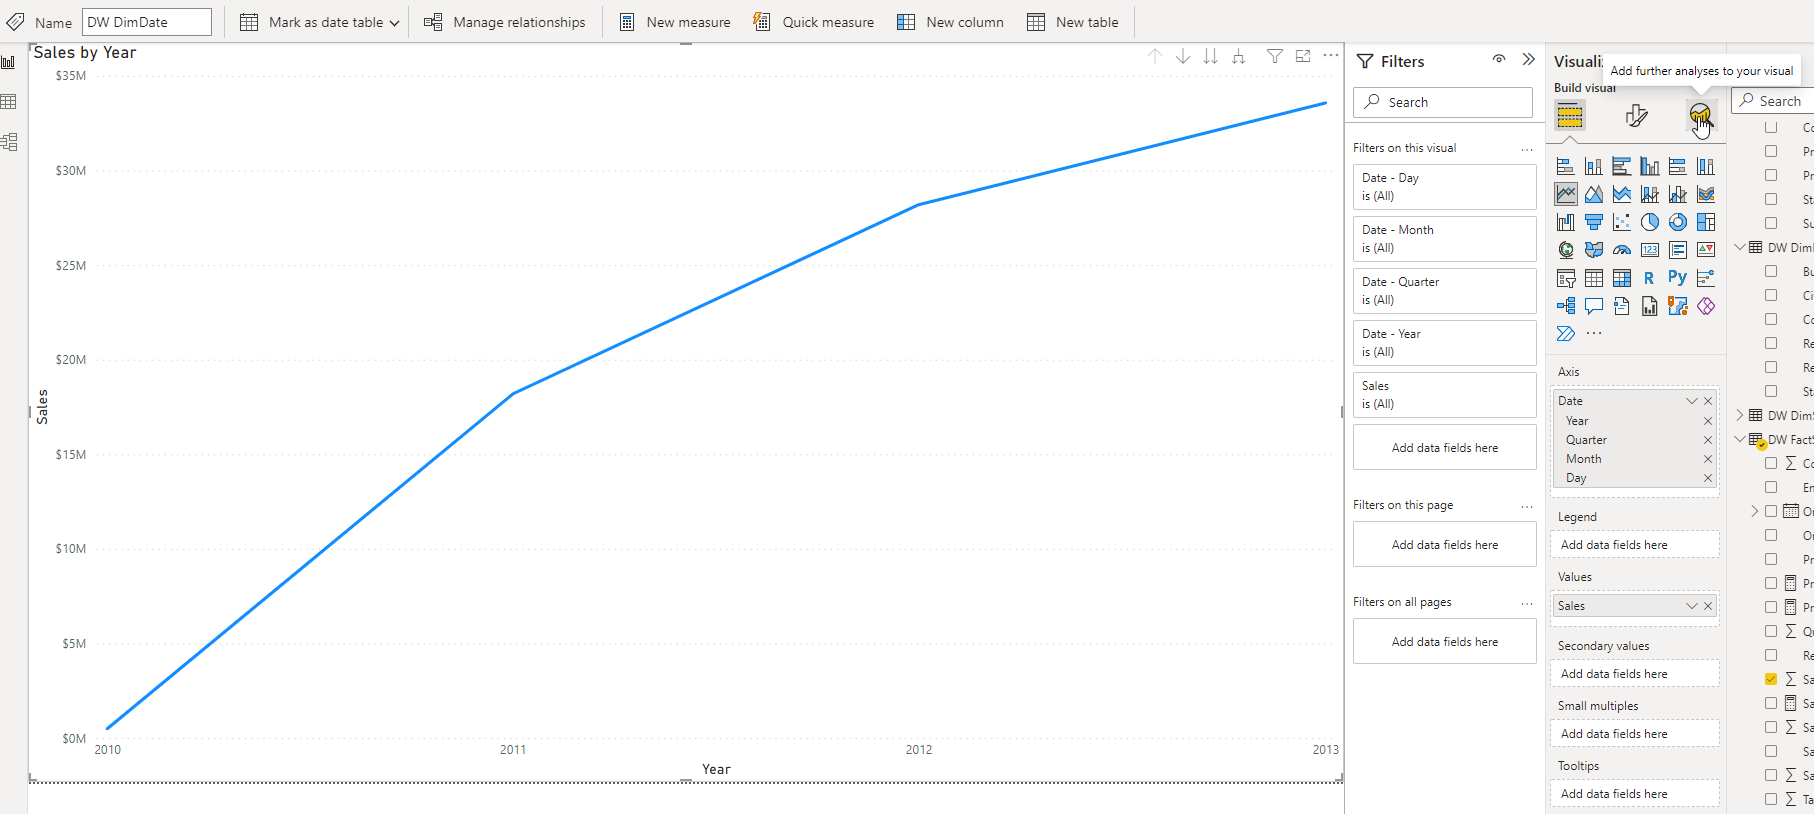
Select Line Chart visual from within Visualizations screen. Expand this visual to take the whole screen.
-
Add DimDate : Date (hierarchy) to Axis drop box
-
Add FactSales : Sales to Values drop box. Click on 3rd icon under Visualization to add more analysis to visual (see this example).
-
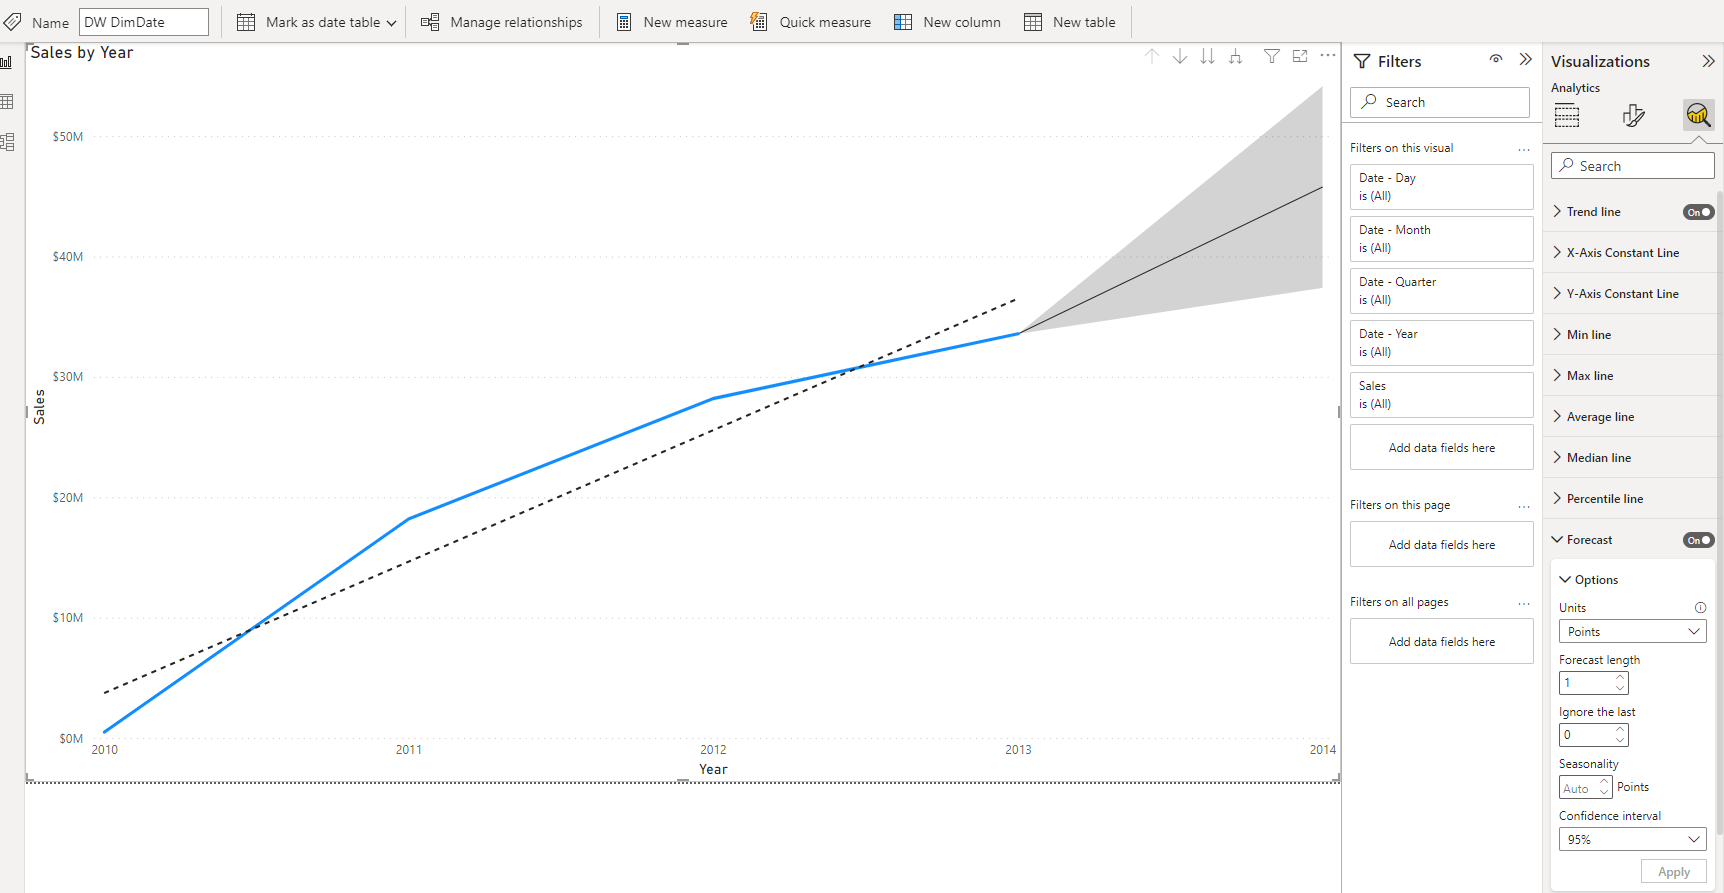
Toggle on Forecast and set following parameters
-
Units: Points
-
Forecast Lenght: 1
-
Confidence level: 95%
Also, for some added fun, toggle on Trendline as well. Your resulted screen would look something like this.
-
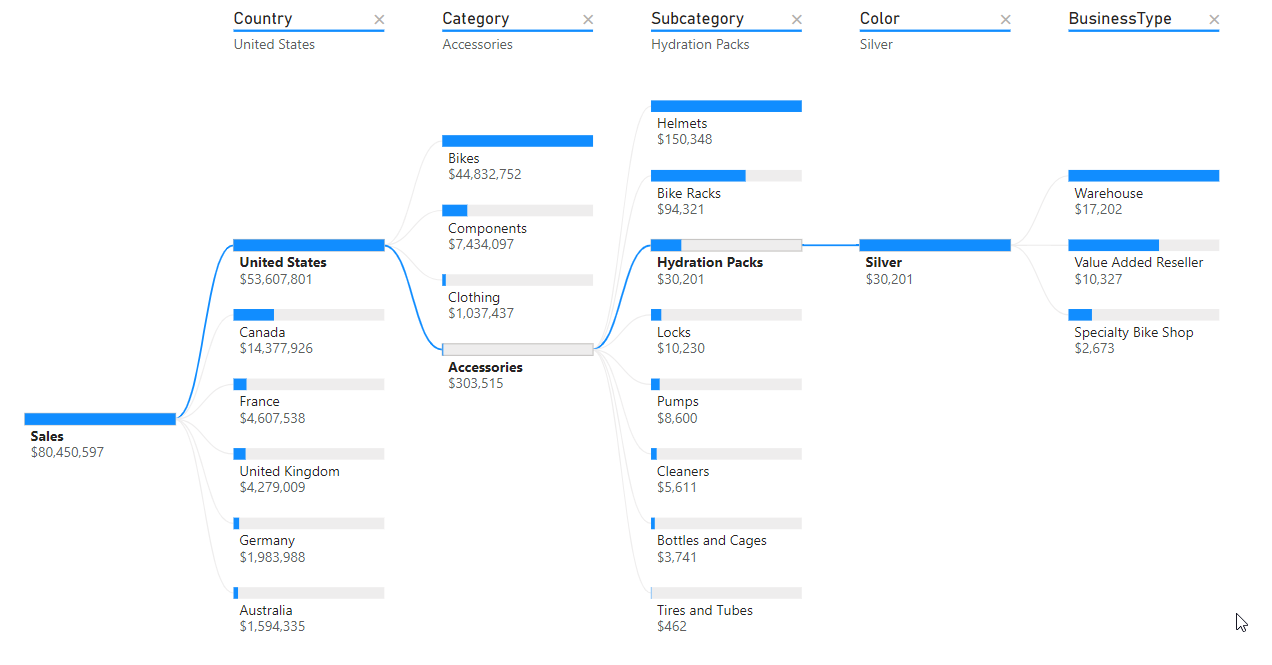
Top Down Analysis (Decomposition Tree)
-
Add a new tab to the report and rename it to Decomposition
-
Select Decomposition Tree visual from within Visualizations screen. Expand this visual to take the whole screen.
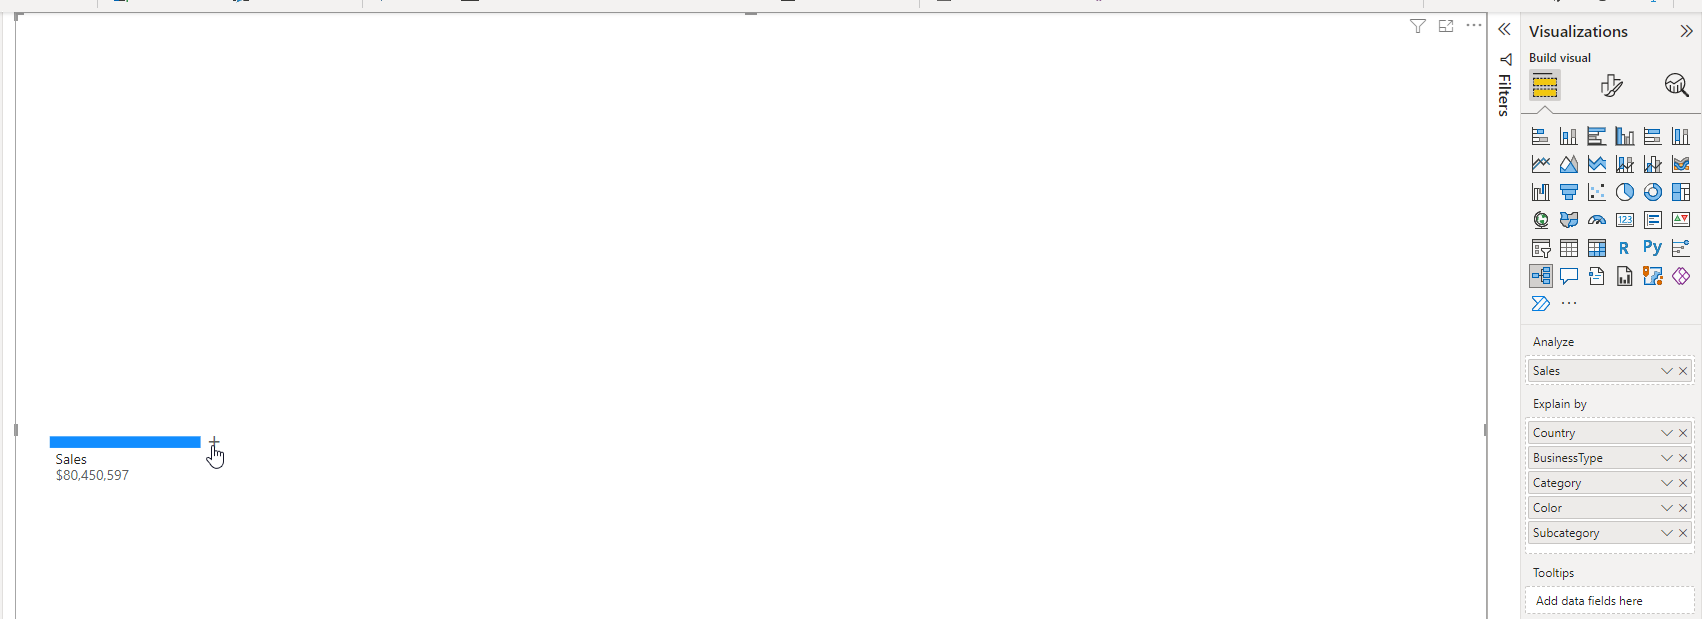
- Add FactSales : Sales to Analyze, and following columns to Explain by drop box
-
DimReseller : Country
-
DimReseller : Business Type
-
DimProduct : Category
-
DimProduct : Subcategory
-
DimProduct : Color
-
-
Click on + sign at the end of Sales visual (as shown here) and add the elements (some or all) in your order of choice. A sample view is here.
-
Explore this visual by clicking on values in any order.
- Change the order of analysis by removing some elements by clicking on X against the elements and add more options as you like.
Causation (Key Influencers)
-
Add a new tab to the report and rename it to Influencers
-
Select Key Influencers visual from within Visualizations screen. Expand this visual to take the whole screen.
- Add following attributes to drop box
-
FactSales : Sales to Analyze, and
-
DimProduct : Color to Explain by
Evaluate the findings along with the Trainer. Understand the Increase and Decrease influencers, and explore Top Segments data.
-
- Reset the previous setting by removing previous value and add following to Explain by drop box
- DimProduct : SubCategory
Evaluate the findings along with the Trainer. Understand the Increase and Decrease influencers, and explore Top Segments data.
Please note that we can add multiple columns to Explain by. We are focussing on one attribute at a time to be able to explore it better.
- Reset the previous setting by removing previous value and add following to Explain by drop box
- DimProduct : SubCategory
Evaluate the findings along with the Trainer. Understand the Increase and Decrease influencers, and explore Top Segments data.
- Reset the previous setting by removing previous value and add following to Explain by drop box
- DimProduct : StandardCost
Evaluate the findings along with the Trainer. Understand the Increase and Decrease influencers, and explore Top Segments data.
- Reset the previous setting by removing previous value and add following to Explain by drop box
- DimReseller : BusinessType
Notice that system confirms for there being no influence (for given metrics).
- Reset the previous setting by removing previous value and add following to Explain by drop box
- FactSales : Quantity
Evaluate the findings along with the Trainer. Understand the Increase and Decrease influencers, and explore Top Segments data.
Get more Visuals
Explore the Gallery, and see if you can find Visual options for some of the tools / technology solutions you have already in your environment.
Working with Paginated Reports
-
Create a paginated report with Data Source as SalesAnalysis PBI Dataset
- Create data set with following attributes:
-
Profit, ProfitMargin
-
Year, Category, Subcategory, Product
-
-
Create the paginated report with Year as a filter/ parameter, and add rest of attributes to Matrix visualiation.
-
Add Built-in Fields PageNumber to the page footer
-
Run the report, providing Year values as 2010, 2011
- If you have PBI Premium Account, publish the report back to PBI Service You can access the final Paginated report here.