
Lab instructions on exploring and using PBI Service online.
Explore the service
Lets explore the service online before jumping on the triad of Consume - Create - Collaborate.
-
Sign in to PBI Service (https://app.powerbi.com) using your corporate account or provided demo account (check with instructor). Browse the service alongside Instructor to see all the options. Revisit Apps, Deployment Pipelines later.
-
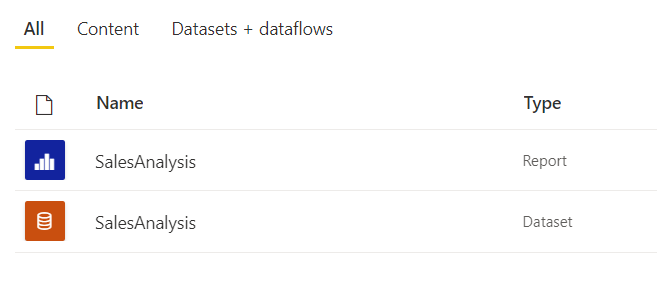
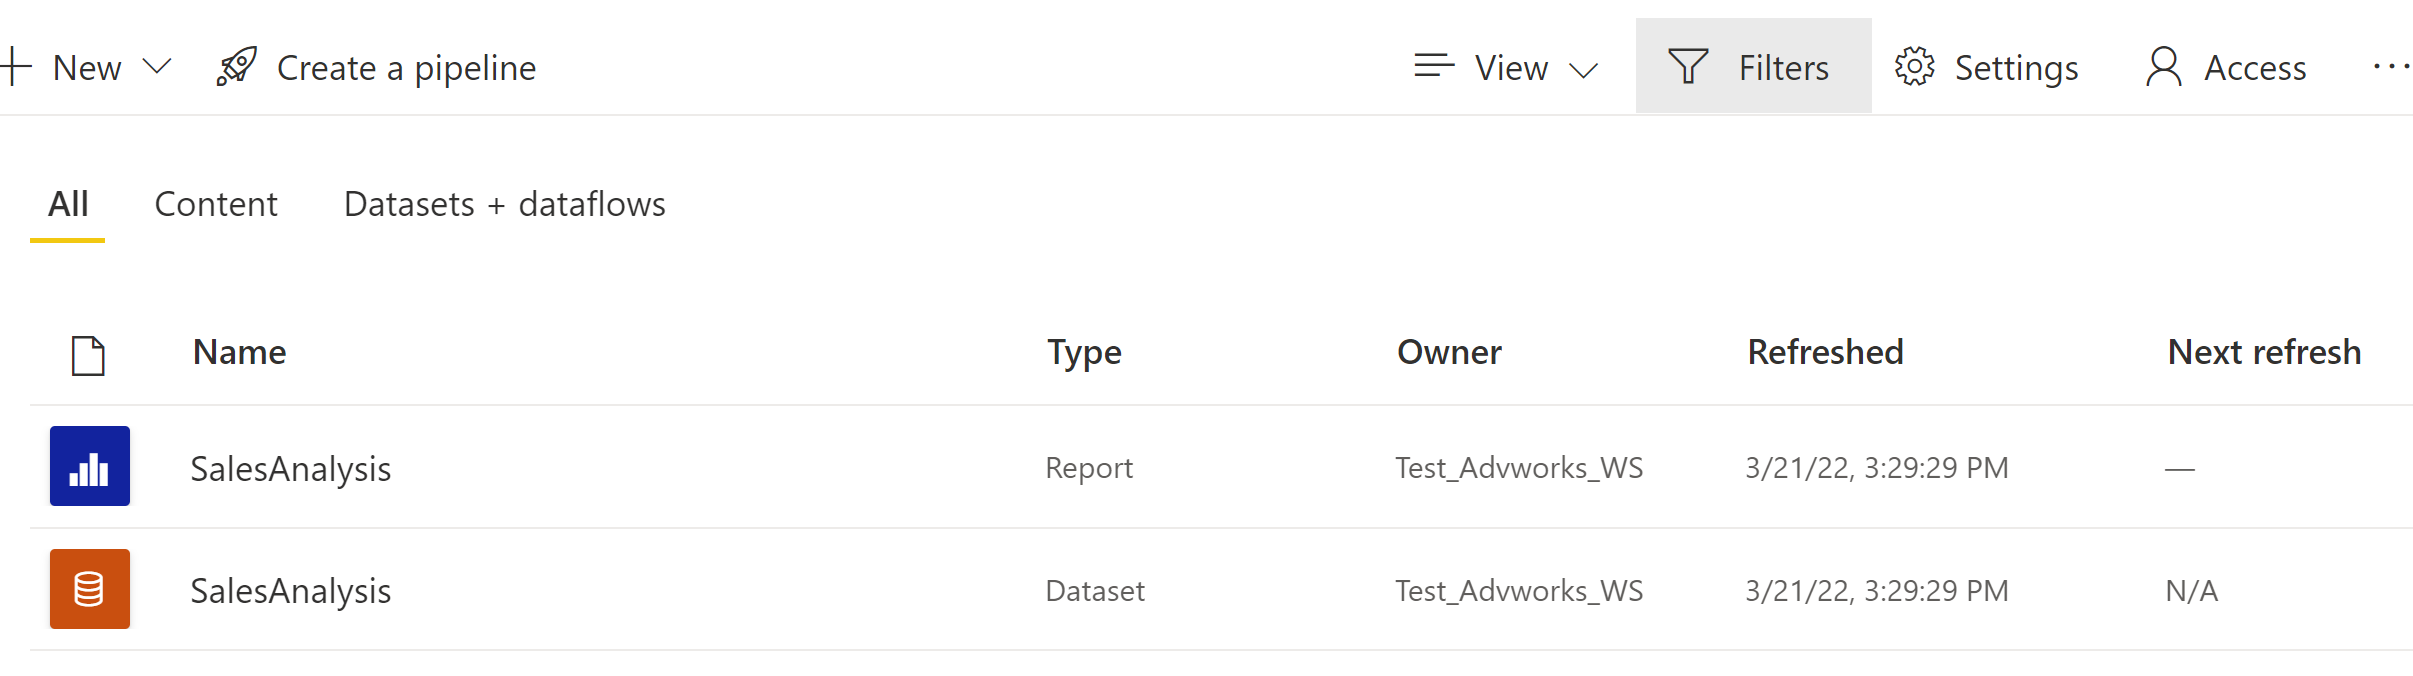
Browse to My Workspace (unless instructors has called out for a shared workspace to be used) and explore the enlisted objects.
-
Notice details like file type’s (report, dataset), ownership, last refresh and next refresh, endorsement (ref) and sensitivity (ref)
-
Explore the report across tabs. Consider interactivity, navigation (like links), menu options, filter sync, conditional visuals, Analyze function etc.
PBI Service : Consume
- Explore the options for reports , especially
-
Settings
-
Manage Permissions
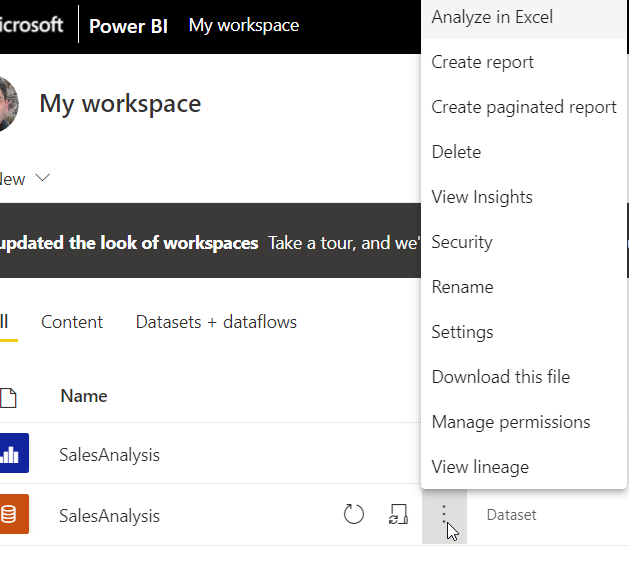
- Explore the options for Dataset, especially
-
Schedule Refresh
-
Description, Gateway, Sensitivity label
-
Gateway connection (requires installation), Data source credentials, scheduled refresh
-
Endorsement (ref )
-
-
Analyze in Excel
-
Quick Insights
-
Settings
-
Manage Permissions
-
View Lineage
-
PBI Service : Create
Create a Report Online
-
Select Homepage, click on + New Report button
-
Select Pick a published dataset, select the dataset you published previously and click on Create button
-
Explore the options and layout, and recreate Overview tab (from PBI Desktop workshop) for practice
Create a Dashboard
-
Open any of the PBI reports as published on PBI Service.
-
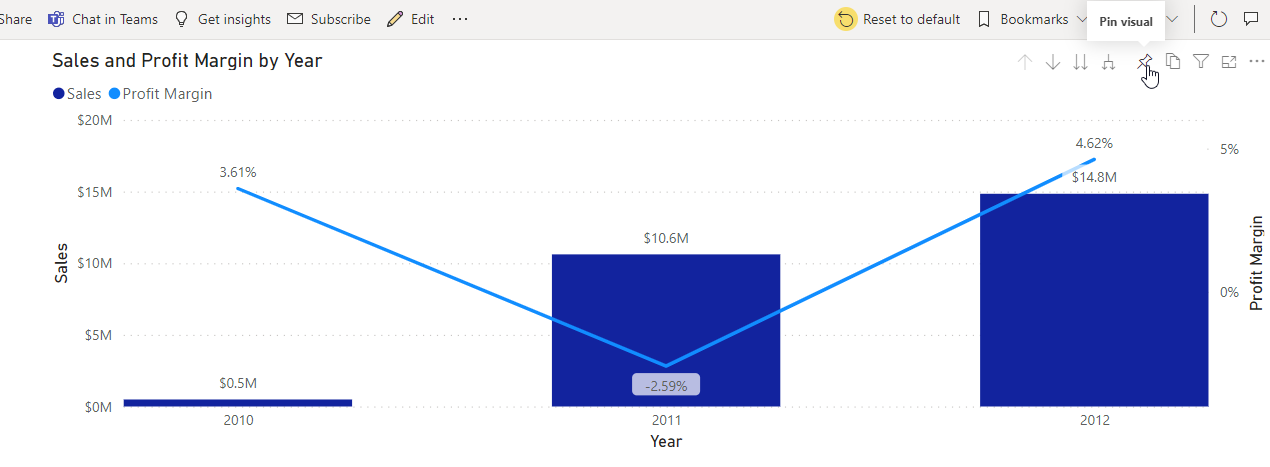
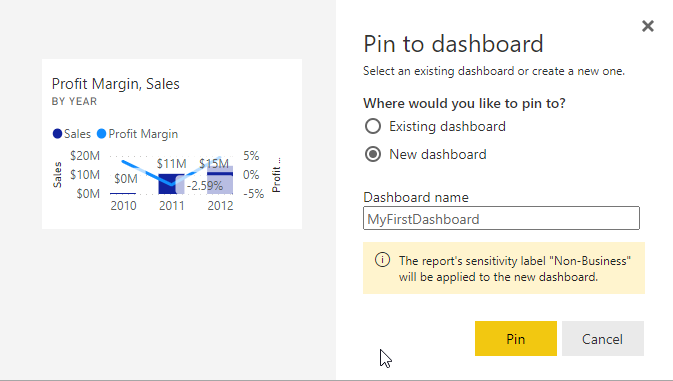
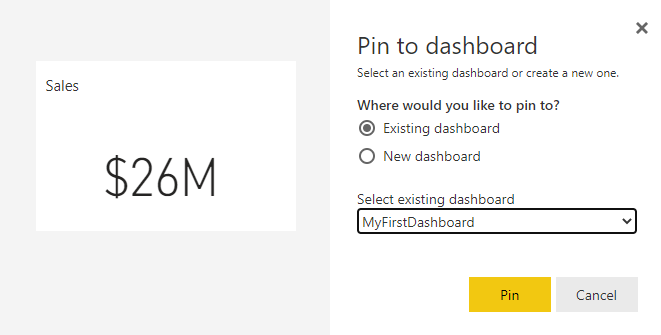
Hover the cursor on any of the visuals you would like to add to your Dashboard, and click on Pin Visual link (as shown here). On subsequent screen, choose to save as new Dashboard and provide a name as preferred (example).
-
Repeat the process for couple of visuals (of your choice), only this time add them to an existing Dashboard, i.e. the one you created previously (example).
-
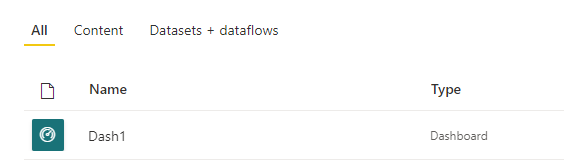
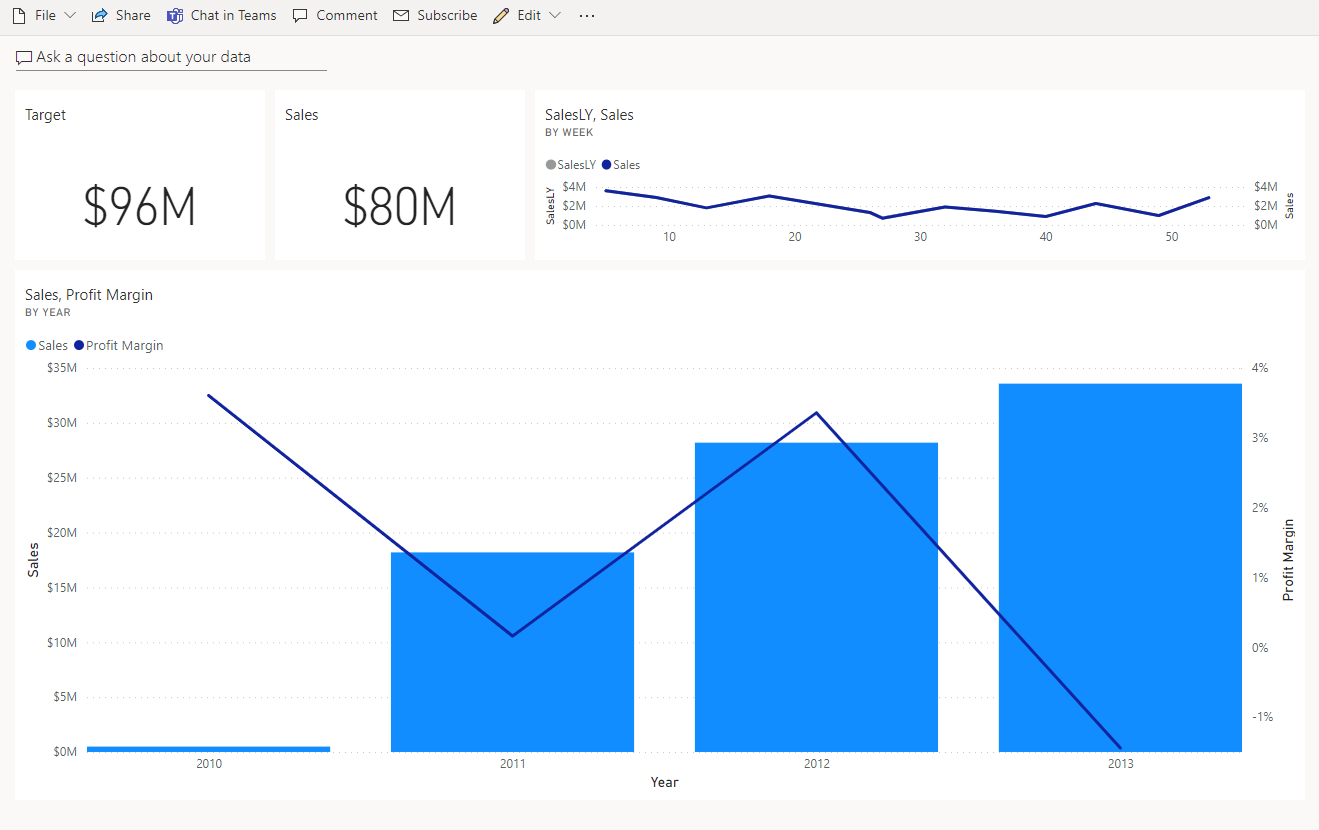
Once you are done, either you can view the Dashboard by clicking on Go to Dashboard button on the confirmation pop up, or you can browse to the workspace, and click on the Dashboard from within the list of objects (example of Dasboard listing, and view of Dashboard).
-
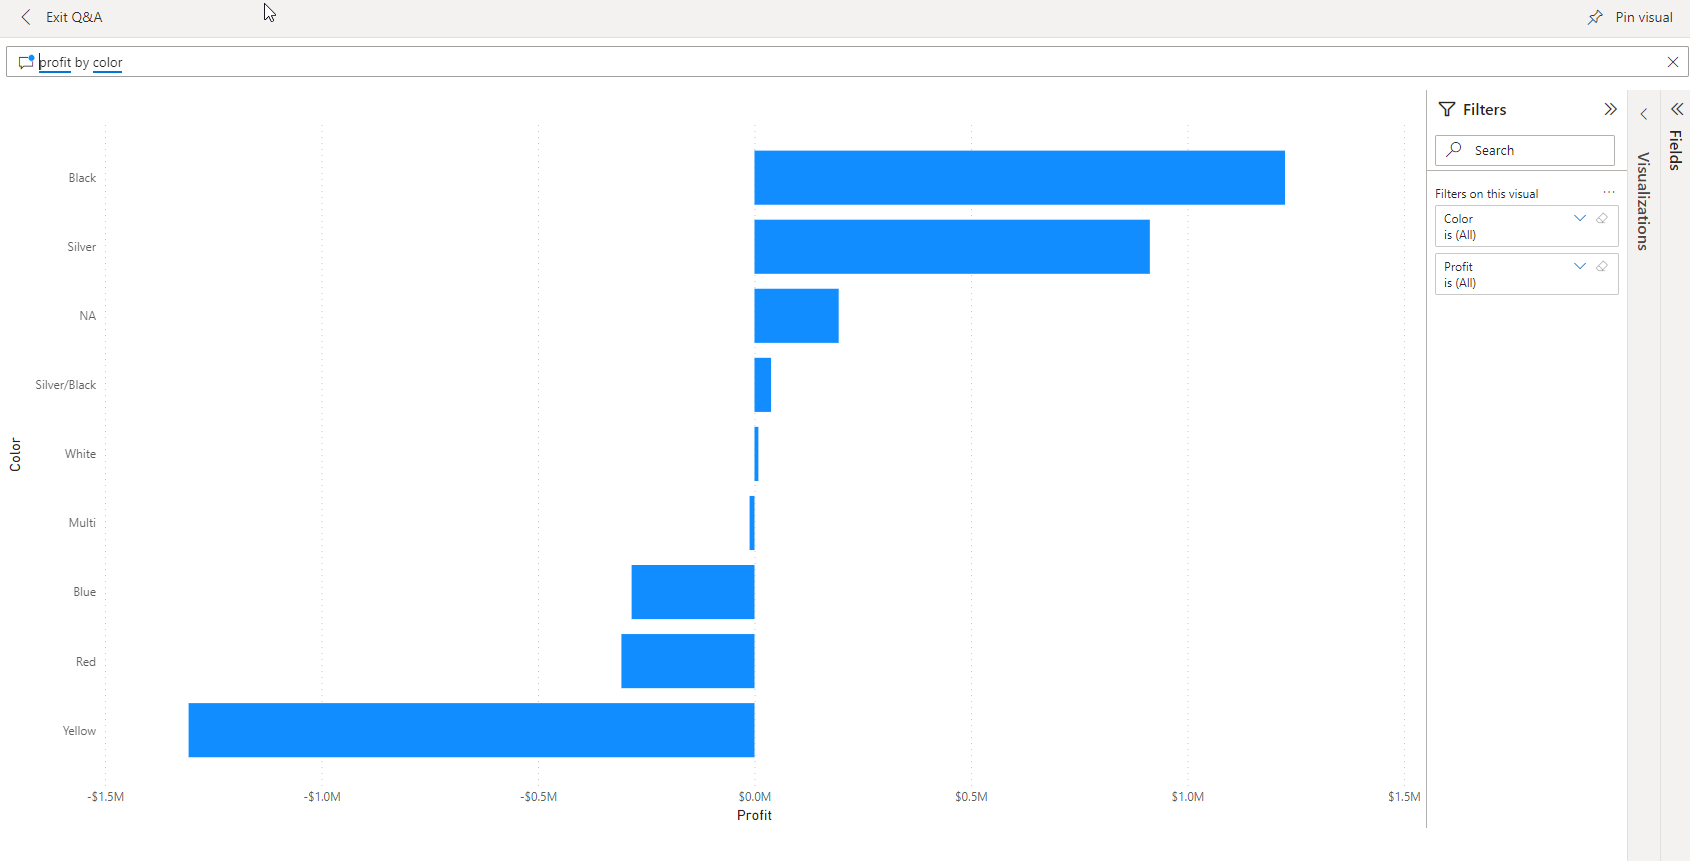
Feel free to explore the options and views more with Dashboards, for example using subscription, Q&A etc.
PBI Service : Collaborate
- Report level
-
Comments
-
Bookmarks
-
Teams
-
Subscribe
-
Export (PDF, PPT, Excel)
-
Create a Workspace and App
- Create Workspace
-
Click Workspace -> Create a Workspace
-
Provide a workspace name (e.g. Test_AdvWorks_Initials), Description. Review all other (Advanced) settings.
-
- Upload Content (PBI Report)
-
Open the PBI report you previously created using PBI Desktop
-
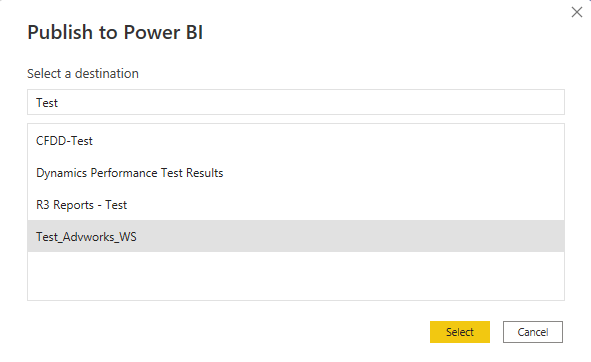
After saving the file (in case there was any change made), click on Publish and point to the Workspace you created in previous steps (ref ) and click on Select button
-
- Create and Publish App
-
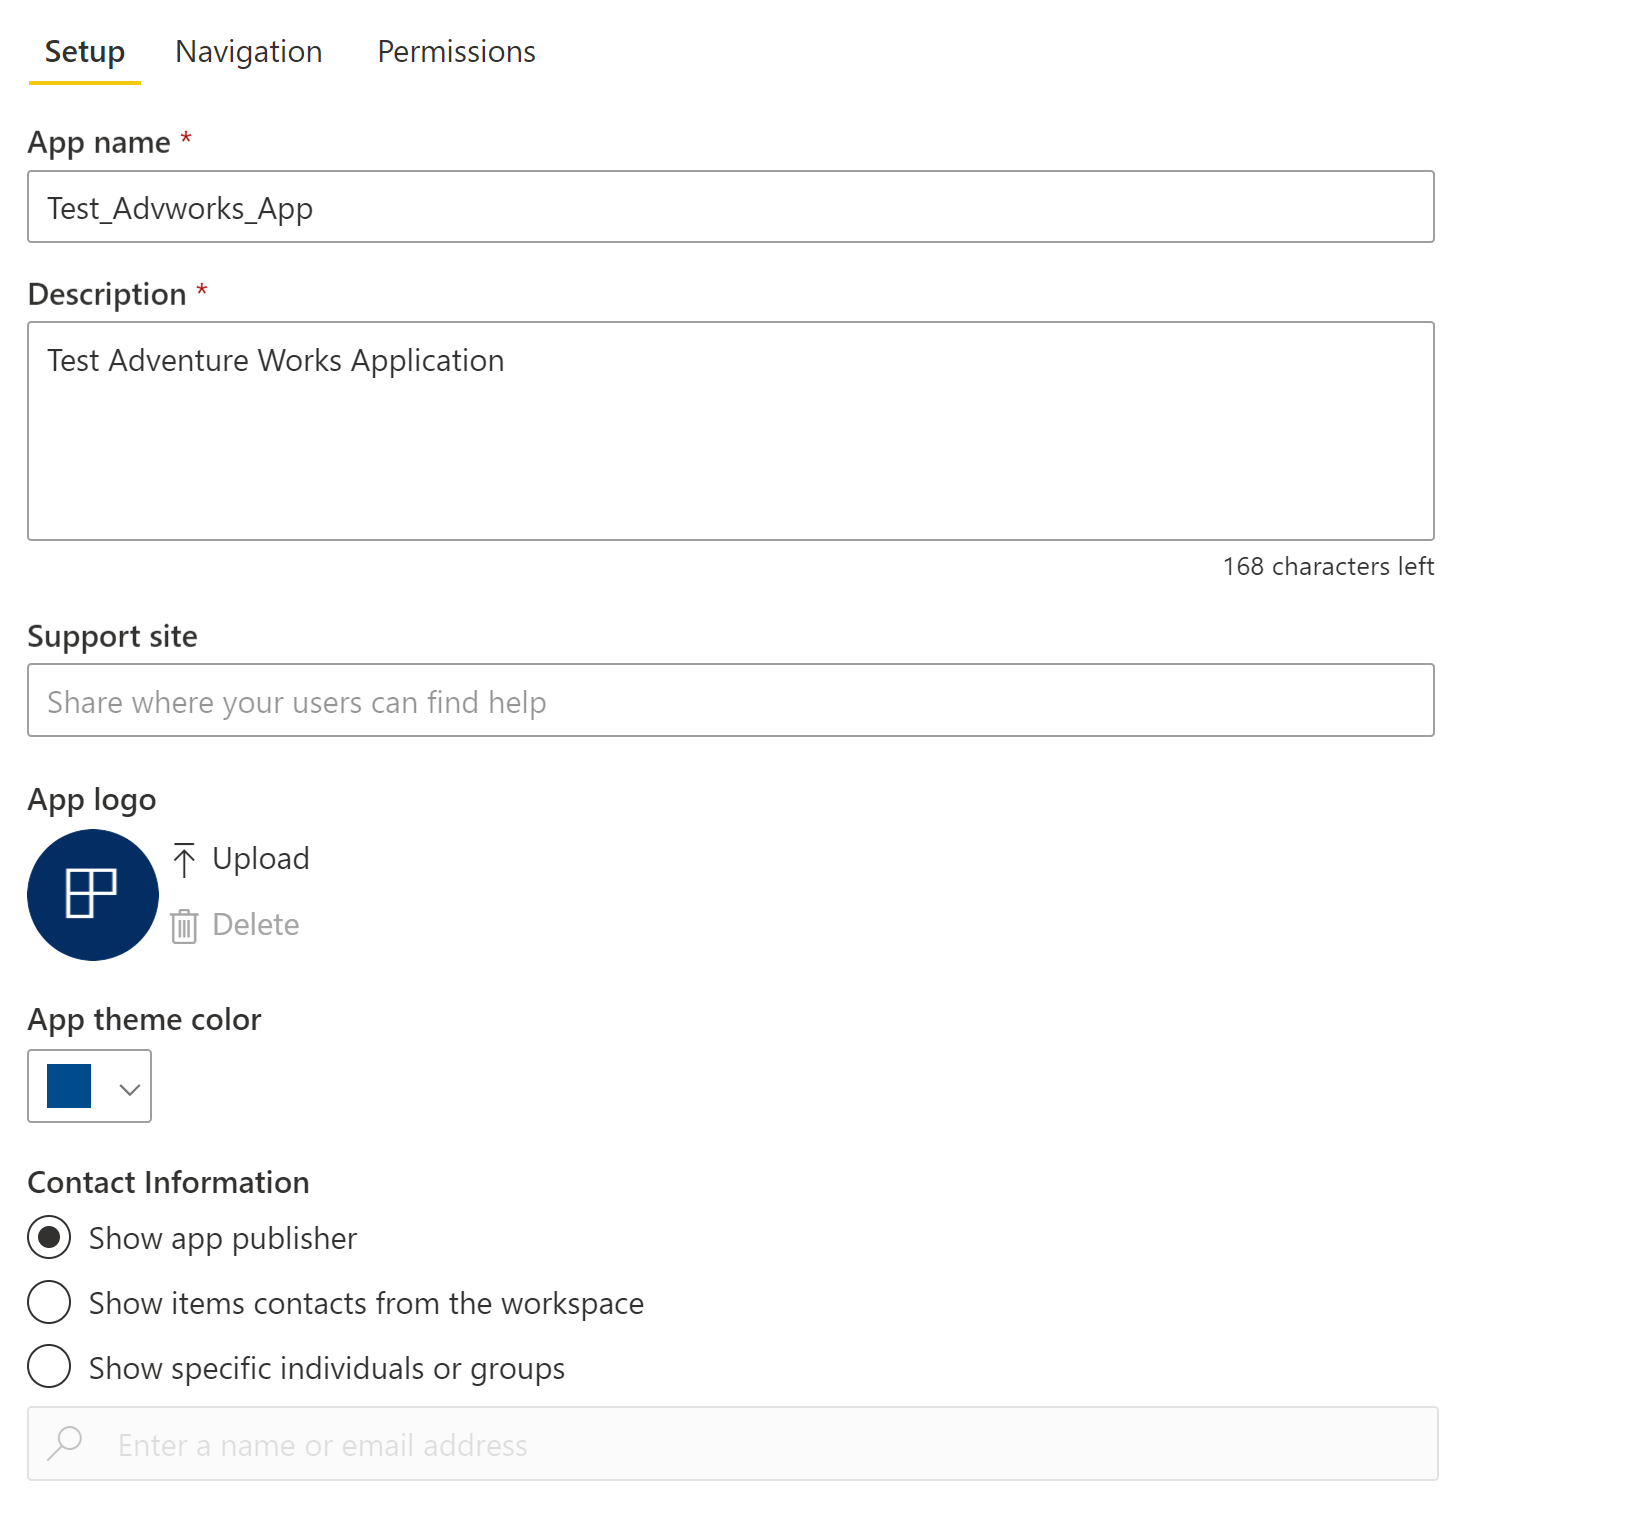
Click on Create app on top right of the page
-
Provide App name, description (setup page)
-
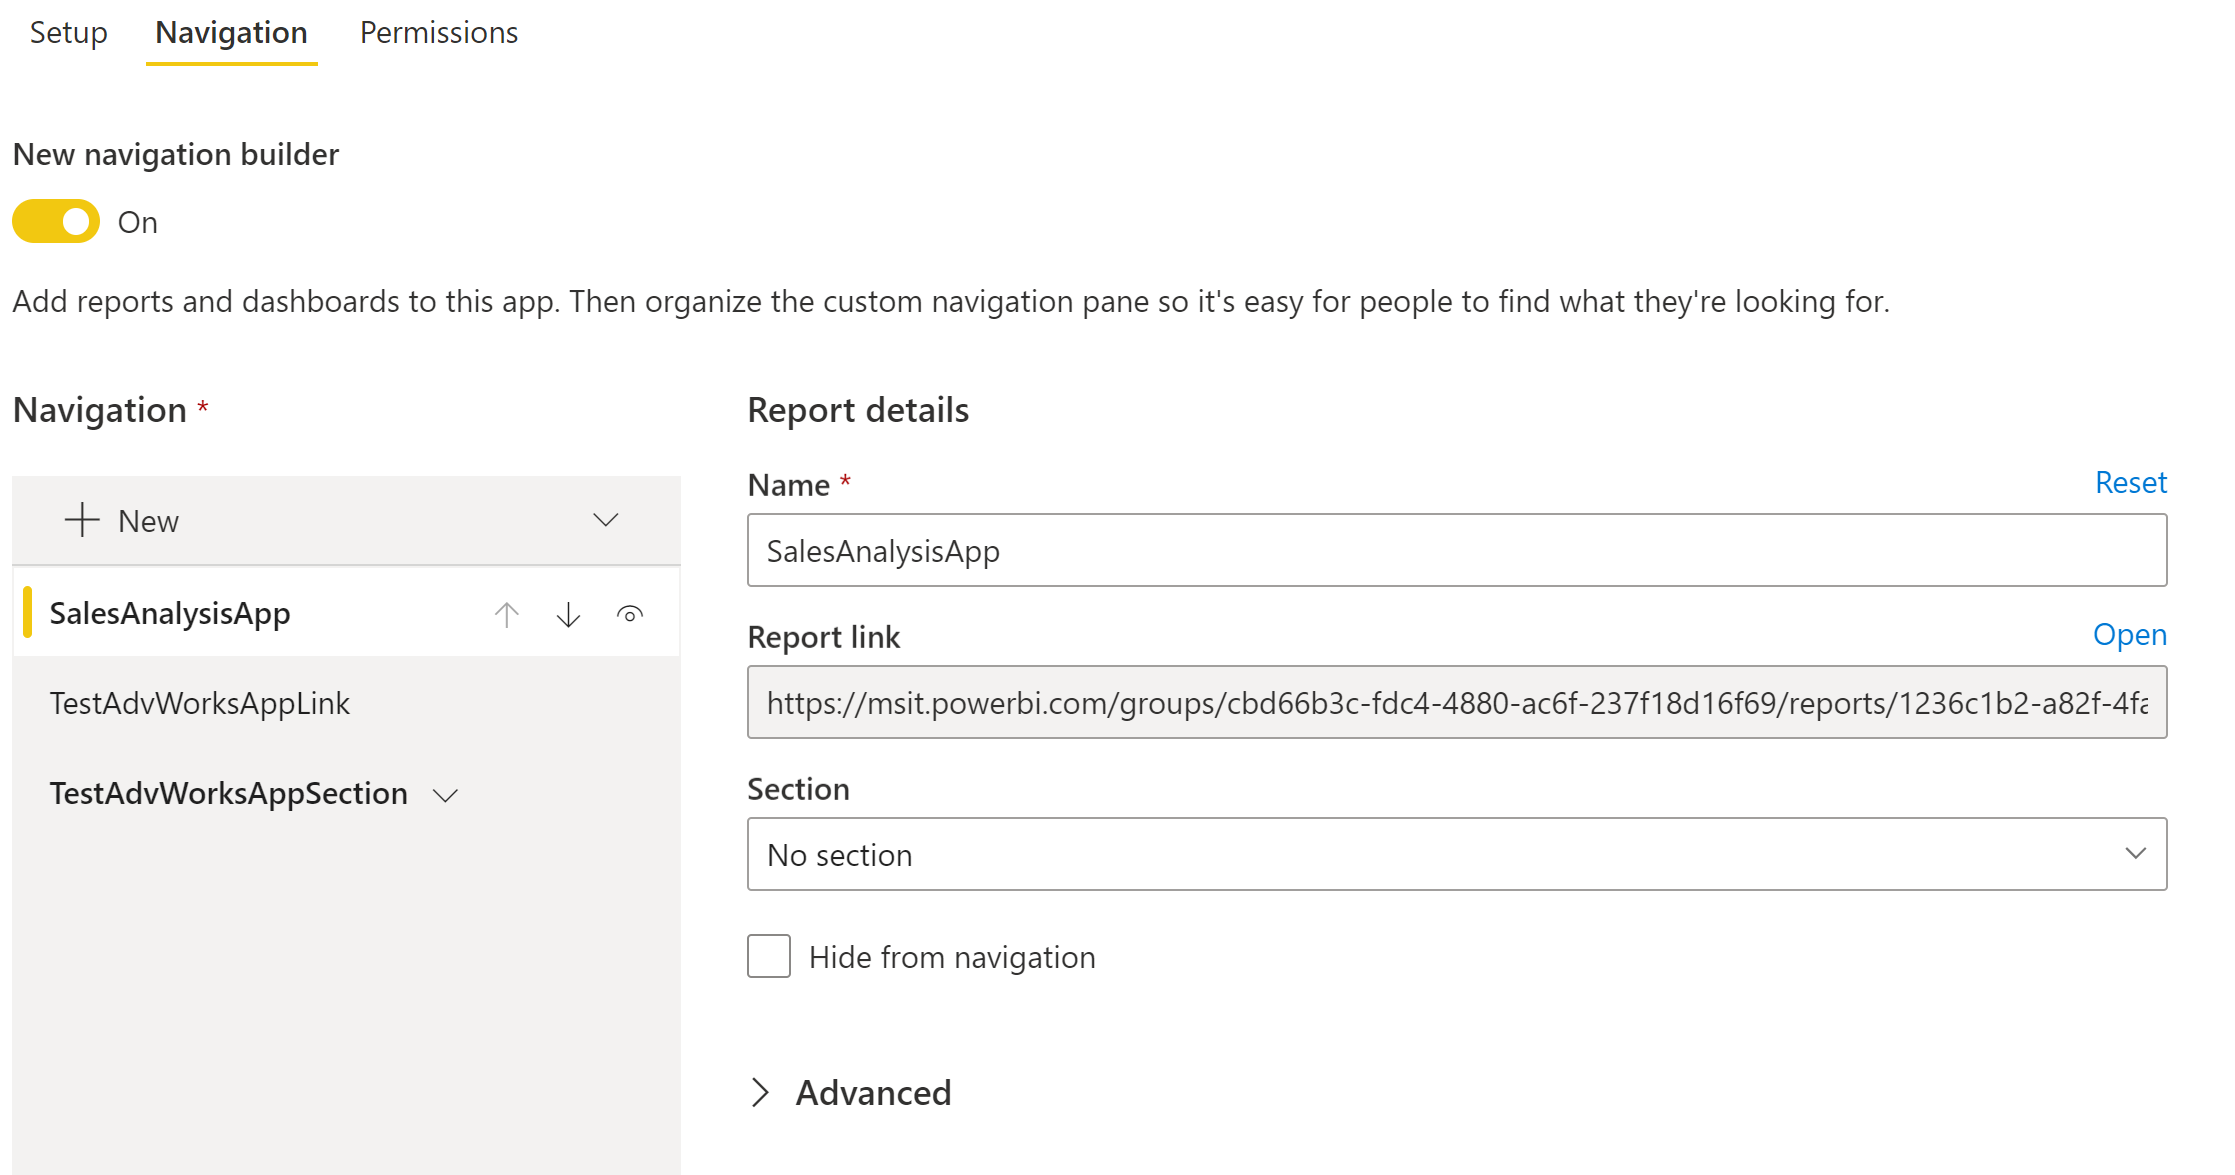
Provide sections, link etc. (navigation page)
-
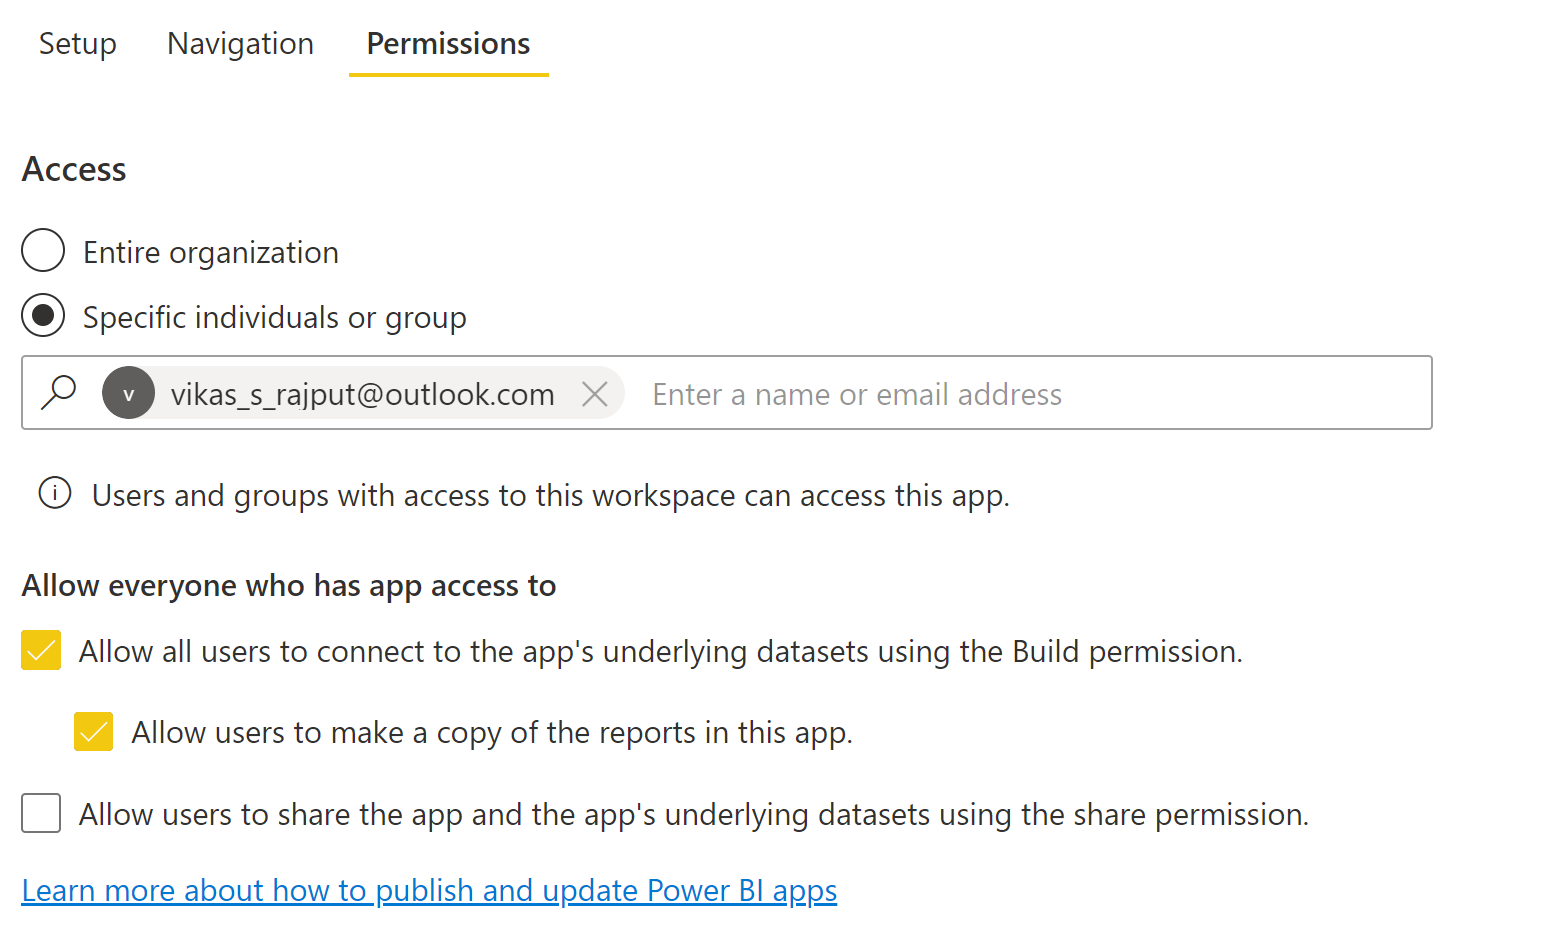
Setup permissions for the app - user or group levels (navigation page)
-
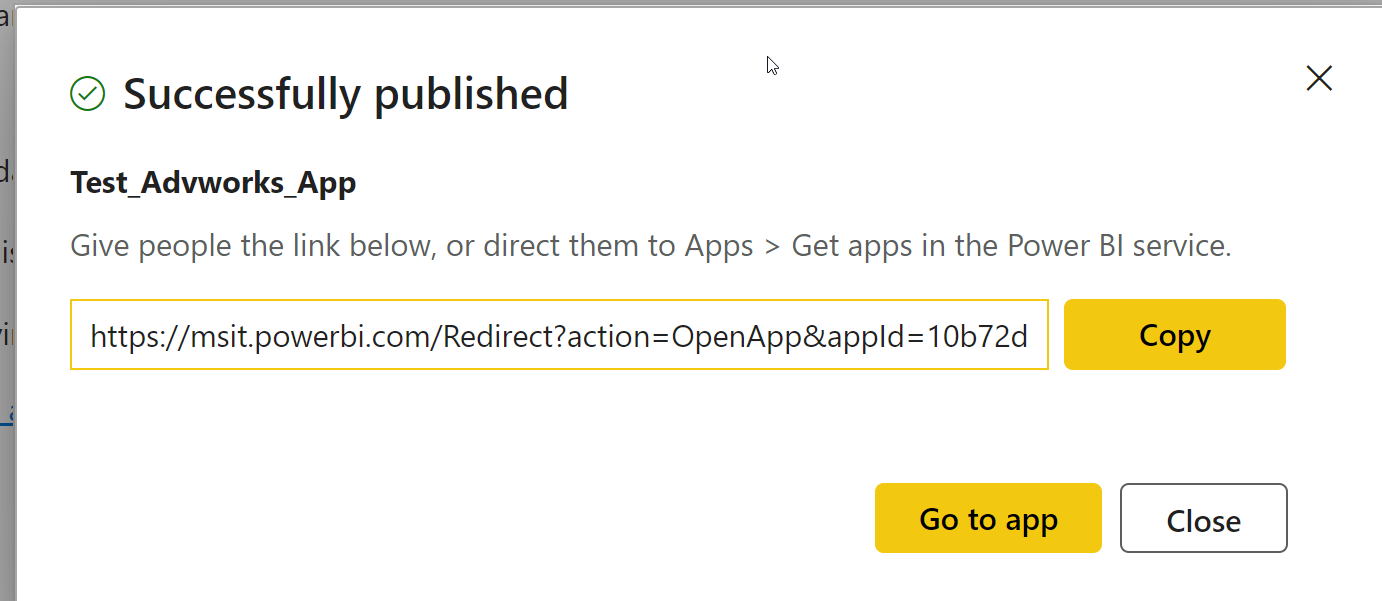
After clicking on create button, confirmation message with links to App would look something link this
-
Explore the App for its contained Reports and Dataset
-
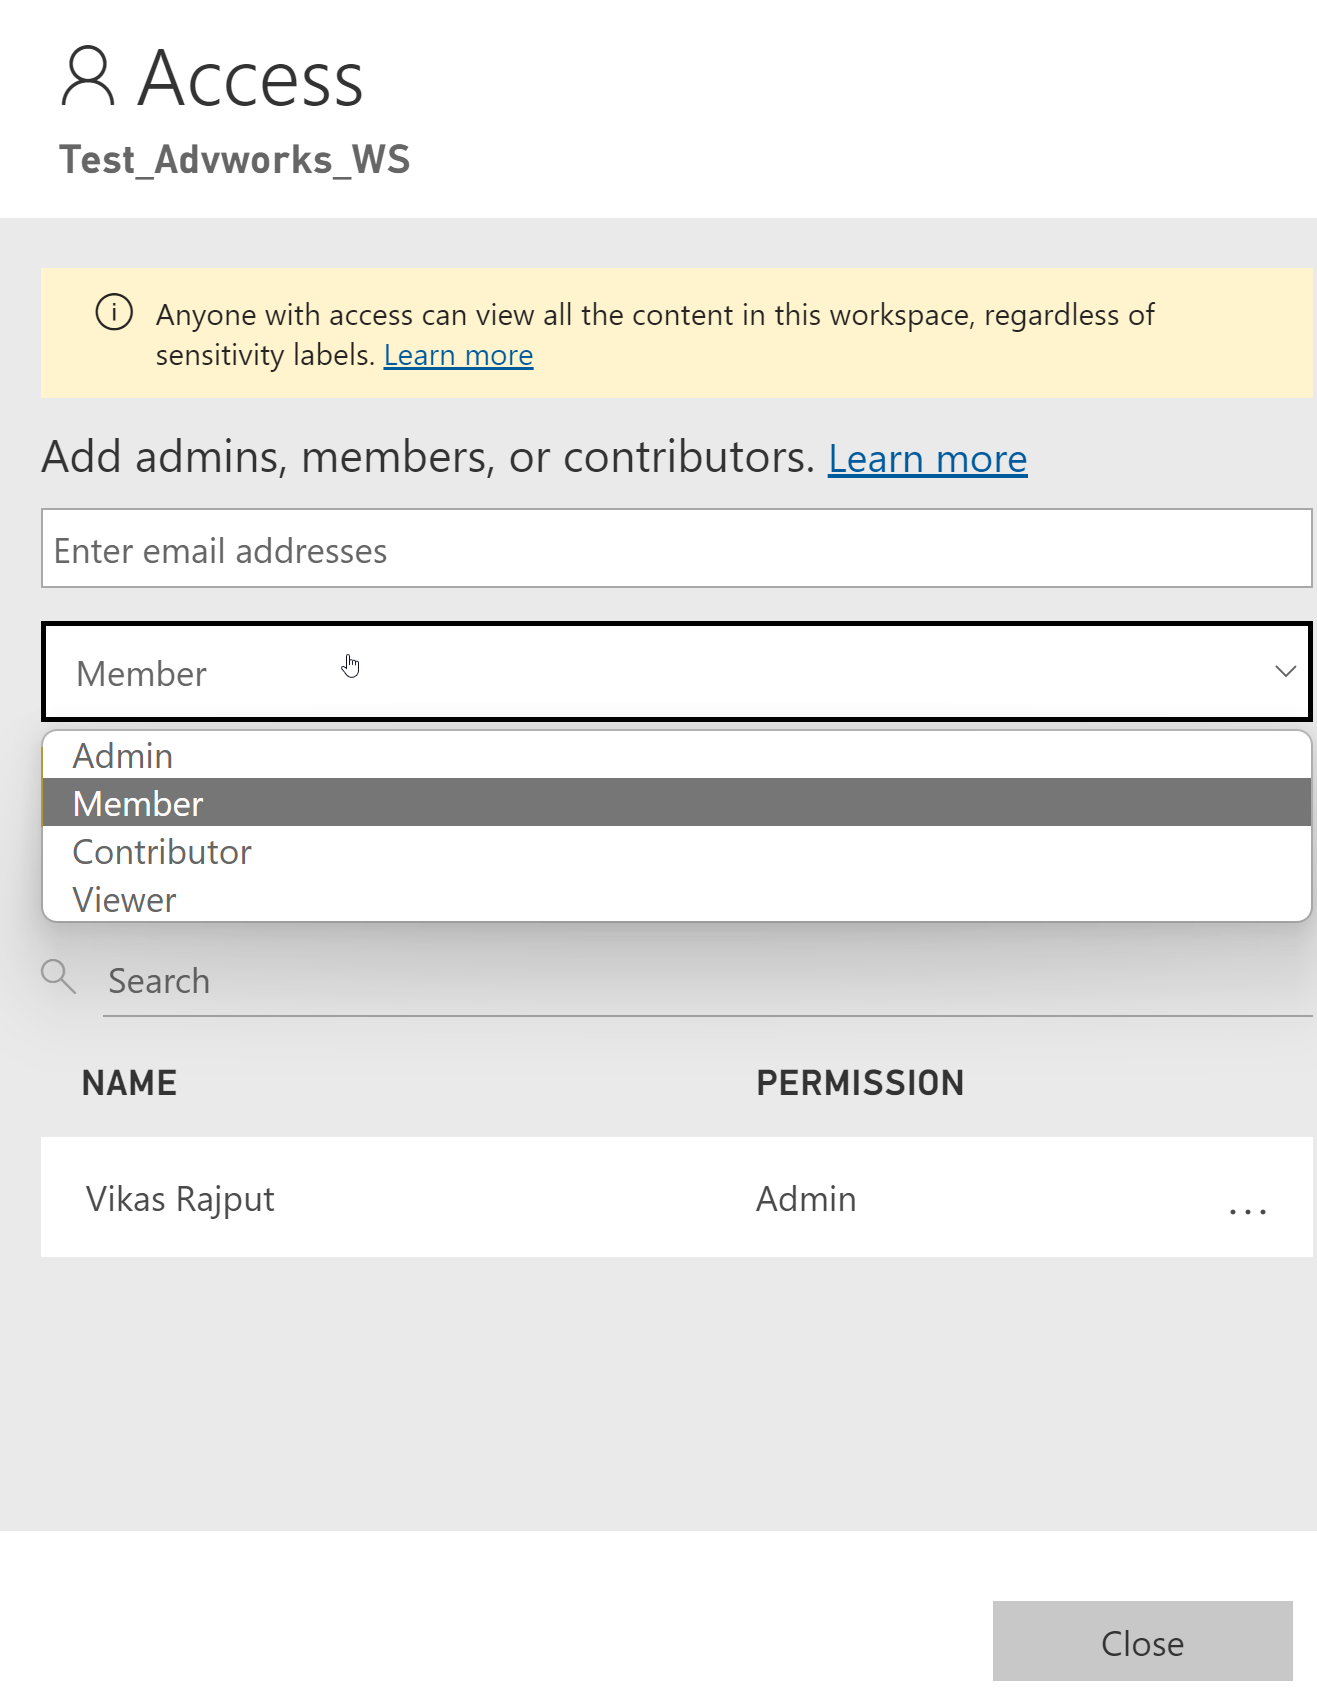
Go back to App’s main page and click on Access button to explore/add user/groups with needed permissions
-